From total CPU to individual apps
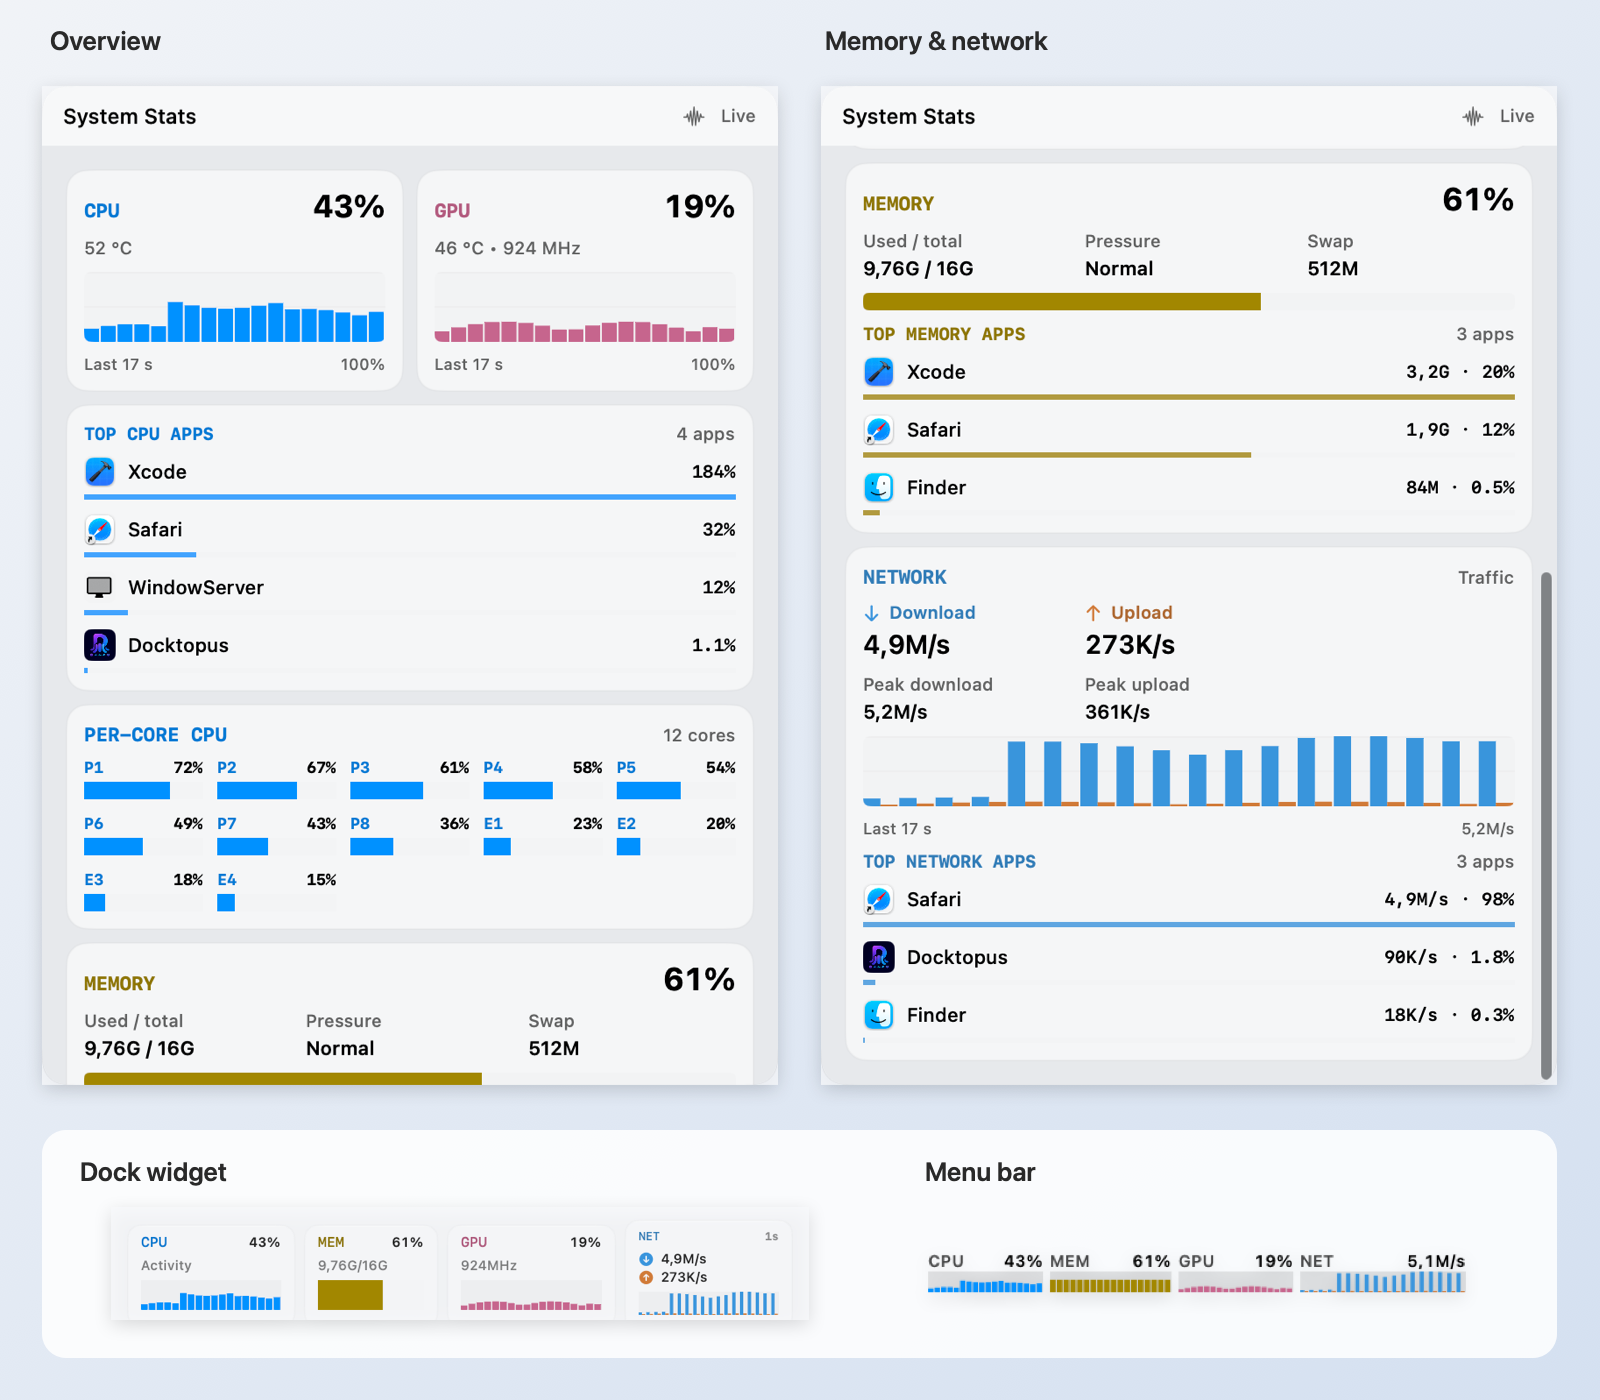
Follow recent CPU activity, inspect individual cores, and see which apps are busiest. Performance and efficiency cores are labeled when your Mac exposes that information. Overall CPU is a share of all cores; app CPU follows Activity Monitor, where 100% means one fully used core and an app can exceed 100%.
Memory with useful context
See used and total RAM, swap usage, the memory pressure reported by macOS, and the apps using the most resident memory. Pressure is separate from the percentage of RAM in use. App rankings group related processes; shared memory can be counted in more than one process.
GPU activity and available sensors
Check recent GPU activity alongside CPU and GPU temperatures and the GPU clock when those readings are available. GPU usage and sensor coverage depend on your Mac and the values exposed by macOS. Missing readings are marked unavailable instead of appearing as zero activity.
Compare download and upload
See transfer rates in bytes per second on the primary network interface, with a fallback to active interfaces, and peak rates for the current System Stats session. Download and upload share one graph scale, so their heights can be compared. Top Network Apps combines each app’s attributed download and upload; its totals can differ from system traffic, and unavailable attribution leaves system totals visible.
Choose how often to refresh
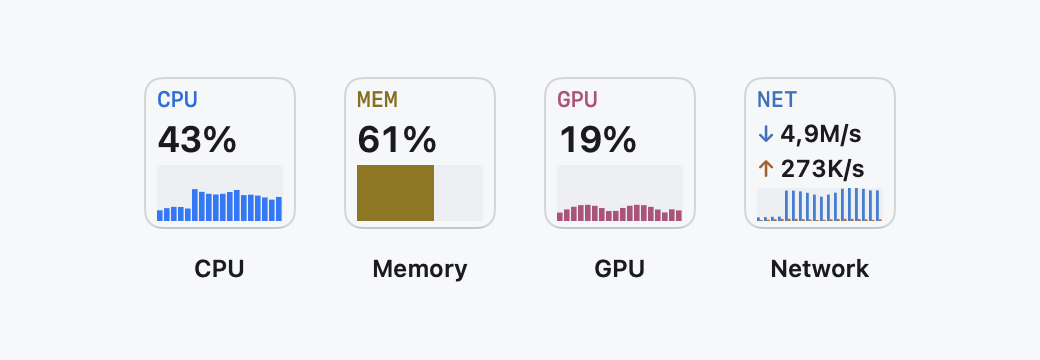
Set dock and menu bar refresh to 2–15 seconds in Settings. System totals update about once per second while the detailed panel is open; app rankings, sensors, and compact GPU readings refresh less often to limit background work. Graphs show recent samples from the current run. Sampling stops when all stats views and the menu bar readout are closed or disabled.
Match your desktop
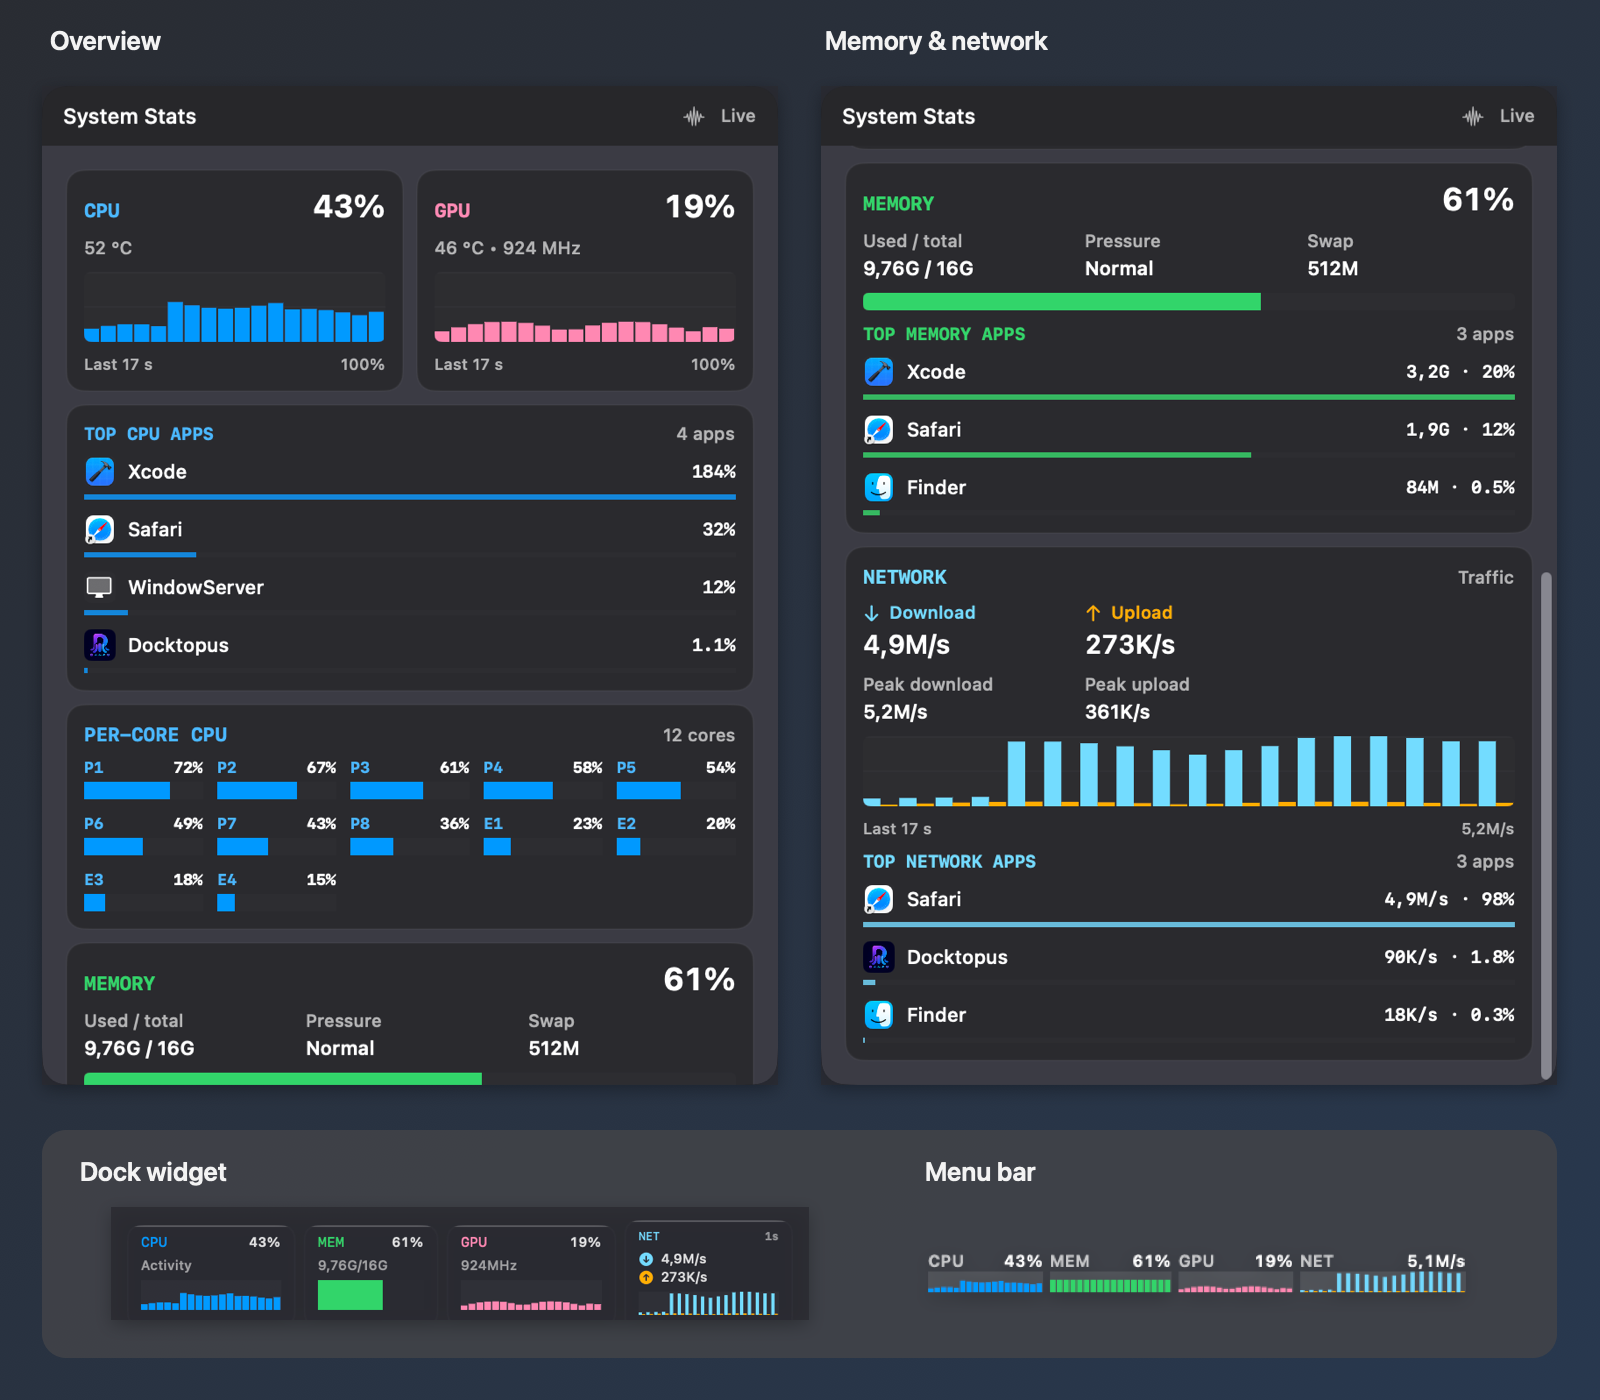
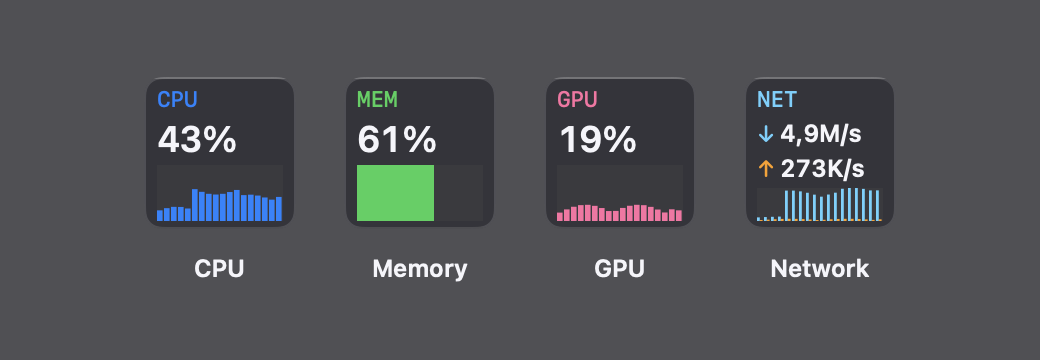
Use Liquid Glass, CDE, or Windows 95, with light and dark presets. Customize CPU, GPU, memory, download, and upload colors across the dock, details panel, and menu bar; titles adapt for readable contrast. Restore Stats Colors returns the selected theme’s metric colors. Opened details stay available while you scroll; close them with Esc or a click outside.